For the past month, I’ve focused this blog on the role that computers can play in assessing students’ mathematical knowledge. I’ve presented three Web Sketchpad-based examples of assessment with mathematical topics ranging from isosceles triangles, to the Pythagorean Theorem, to the slopes of perpendicular lines.
Throughout, I’ve tried to show that the introduction of the computer into the assessment process need not be a limiting factor in the mathematical questions we pose. Indeed, as I discussed in my prior post, assessment when done well can be an opportunity for students to learn new mathematics, and not just repeat what they already know. (To learn of the perils of online assessment, read the report from my former colleague, Steven Rasmussen).
But what about teachers? What can they learn from their students’ assessments? Below is a Web Sketchpad-based assessment question designed by my former colleague, Steve Rasmussen. Try solving it before reading further.
There are several ways to move from an equation of a parabola to its graph. You could explain your method to me in the comments section of this blog, but perhaps that isn’t necessary. There are clues lurking in your graph! Specifically, the placement of points A, B, and C have a story to tell.
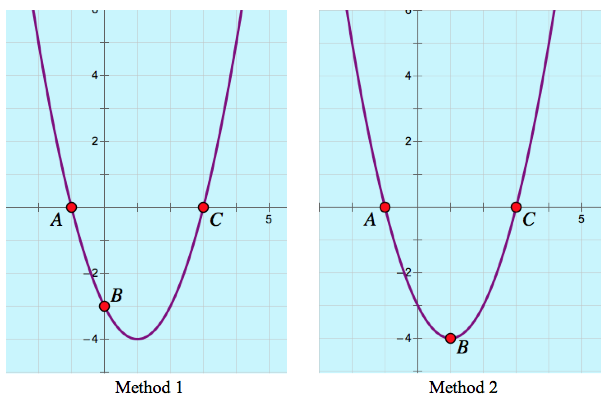
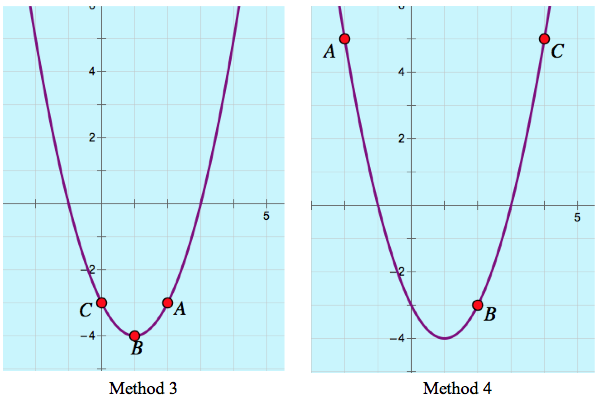
Below are four identical graphs of y = x2 – 2x – 3, each with different locations of points A, B, and C. Imagine that each graph represents the work of a different student . Based on the locations of the points, see if you can describe how each of the students went about graphing the parabola.
OK, how did you do? It’s impossible to know for sure the thinking behind each of the four methods, but here are some reasonable guesses:
Method 1: The student set x2 – 2x – 3 equal to 0, factored it to find roots at –1 and 3, and dragged points A and C to (–1, 0) and (3, 0). She concluded by setting x = 0, finding the y-intercept of (0, –3), and dragging point B to this location.
Method 2: The student set x2 – 2x – 3 equal to 0, factored it to find roots at –1 and 3, and dragged points A and C to (–1, 0) and (3, 0). The student realized that the x-value of the vertex was midway between the two roots at x = 1. Substituting x = 1 into the equation revealed that the vertex was at (1, –4). The student dragged point B to this location.
Method 3: The student completed the square to determine that the vertex of the parabola sat at (1, -4). She dragged point B to this location. The student set x = 0 to determine its y-intercept and dragged point C to this location. Since the parabola is symmetric about its line of symmetry at x =1, the student knew, without performing any calculations, that point A must sit at (2, –3).
Method 4: The student picked three x-values at random (–2, 2, and 4) and substituted each into the equation to determine the locations of points A, B, and C.
Even though we can’t say with certainty whether our analysis is correct, I think it’s pretty amazing how much information we can gleam from the placement of points A, B, and C!


I love the variety of solution methods that this assessment question encourages, and your four methods make me think of another, a variant of the Method 2 you describe (but involving a bit less algebra). After using factoring to place points A and C at the two roots and realizing that the axis of symmetry is the line x = 1, perhaps the student simply dragged point B up and down along this axis until the y-intercept was at -3.
Nicely presented. Seeing as this type of question can only be done after learning multiple ways of graphing, it can help us create intriguing leading questions for the beginning of a unit. Then help them see there are multiple ways of doing something. And also asking what the points you graphed tell you about the graph.