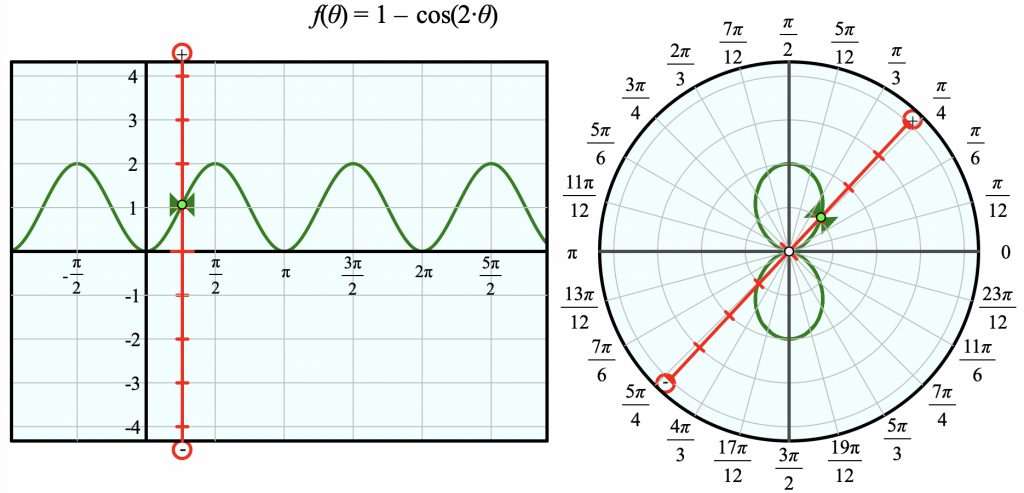
The Web Sketchpad model below (and here) shows the function f(θ) = 1 – cos 2θ in both Cartesian and polar form. For each graph, the independent variable appears as a red bar that corresponds to a particular value of x (for Cartesian) or θ (for polar). The red bar has tick marks that show possible values of the dependent variable (y for Cartesian and r for polar), and a green bow-tie that shows the actual value of the dependent variable for this value of the independent variable.
Here is what it looks like when the slider for θ has been dragged to π/4:

The two red bars (and their green bow-ties) are identical except that the Cartesian one has been translated from θ = 0 to θ = π/4, and the polar one has been rotated from θ = 0 to θ = π/4.
We designed this model to connect the polar and Cartesian representations. Students can animate the independent variable by pressing either Animate Slowly or Animate Quickly. As the animation proceeds, they can observe how the two representations show exactly the same function, with the only difference being that the independent variable’s value undergoes translation on the left and rotation on the right.
For more control, students can manually drag the pentagonal slider back and forth. They can hide the loci of the graphs and turn on tracing to watch the graphs form from scratch. They also can change f(θ) to a different function by double-tapping it and then editing it. (Theta is available under the Values drop-down menu.)
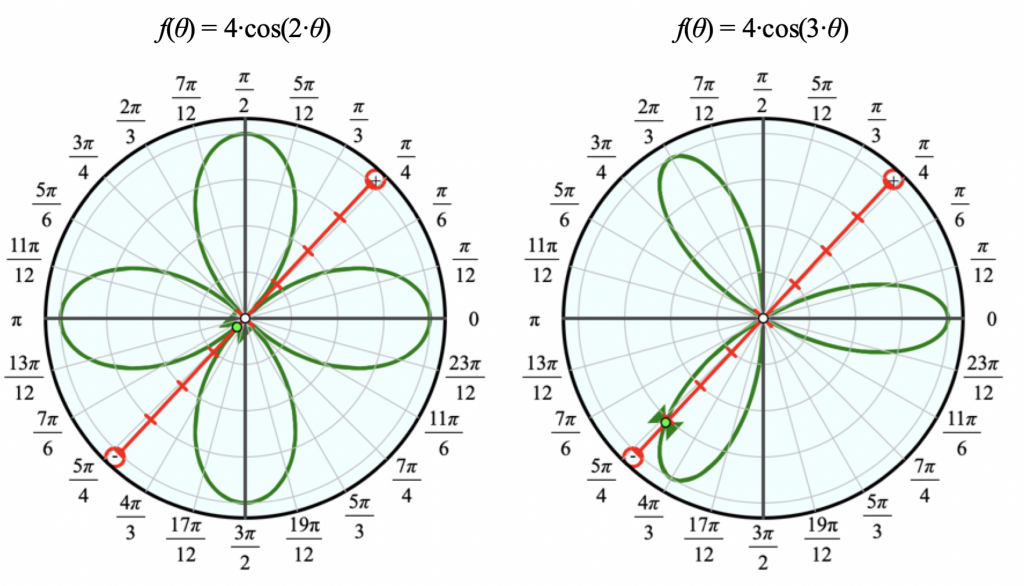
There are many insights and discoveries students can make by dragging the independent variable and observing the graph. For instance, the seemingly counter-intuitive comparison between r = 4 cos 2θ and r = 4 cos 3θ below becomes much clearer when students have the ability to control the value of θ by dragging. Other wonderful questions and realizations can come about by experimenting with a variety of functions.

The information being offered are very useful to us university students. Thank you.